
3D Tiles Building
Display a 3D Tiles building converted from a IFC file with py3dtiles.

3D Tiles Point Cloud
Display a 3D Tiles point cloud.

3D Tiles Simple Viewer
Display any 3D Tiles from a url.

3D Transformations
Transform objects using position, rotation and scale.

Atmosphere
Create a realistic atmosphere and sky dome.

AxisGrid
Illustrates the use of the AxisGrid entity.

Custom controls
Illustrates the use of the camera-controls plugin.

Clipping planes
Clip various entities with clipping planes.

Color Adjustments
Set brightness, constrast, and saturation on color layers and maps.

Colorized 3D Tiles Point Cloud
Illustrates colorization of point clouds with multiple modes.
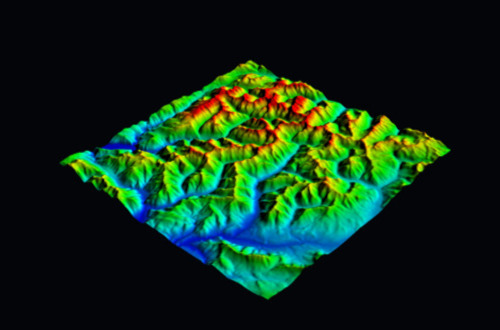
Color maps
Use colormaps to emphasize elevation and terrain features.

COPC
Display a Cloud optimized point cloud

Cropped Elevation COG
Check that an elevation COG works correctly at the edge of the map.

Digitizing vector features
Draw vectors and add them to a map layer

Draw shapes
Enables the user to draw points, lines and polygons.

Ellipsoid
Visualize an ellipsoid.

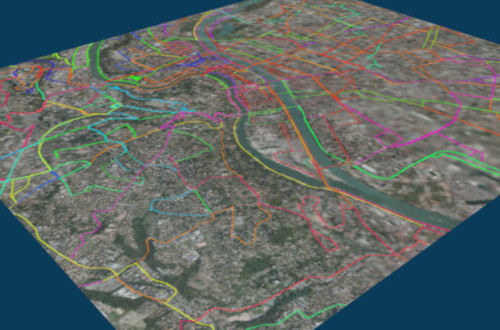
Reprojection of features as mesh
Illustrates the automatic reprojection of vectors to match the instance's CRS.

First Person Controls
Use first person controls to move in the scene

GeoJSON 3D
Represents 3D shapes from a GeoJSON file.

GeoTIFF Bathymetry
Display a fully underwater elevation layer using a GeoTIFF raster.

GeoTIFF channel mapping
Select which bands to view on GeoTIFFs with multiple bands.

Cloud Optimized GeoTIFF (COG)
Display a color COG in various color spaces.

Elevation GeoTIFF
Display an elevation GeoTIFF with a color map.
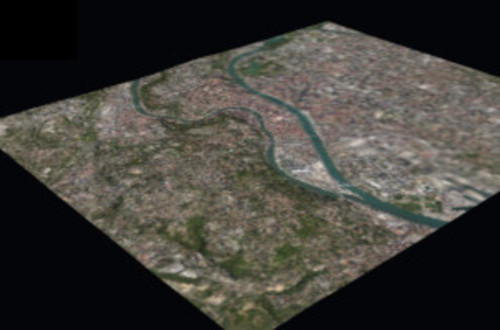
2.5D Map
Display a map with elevation.

Globe
Display a globe-shaped Map.

Google Photorealistic 3D Tiles
Display Google Maps 3D Tiles using Giro3D and 3d-tiles-renderer.
Graticule
Display a graticule on a Map.
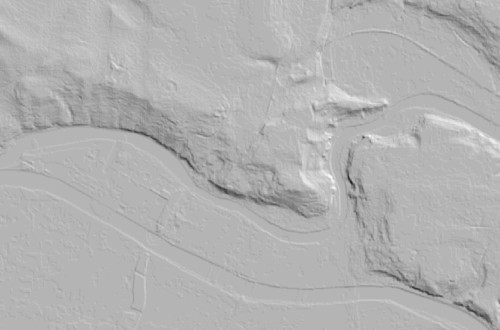
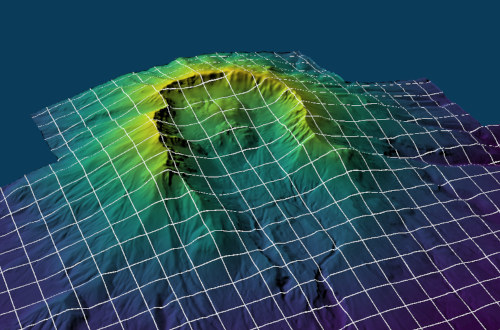
Hillshading & terrain
Illustrate the use of hillshading on maps with terrain.

HTML labels
Display HTML labels in the 3D scene.

IGN data
Use data sources provided by the french geographic provider (IGN).
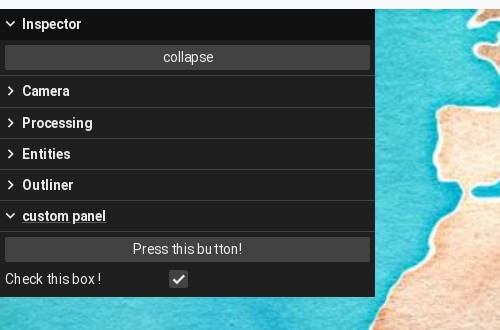
Inspector
Display the inspector with a custom panel.

Dispose instance
Help to test if Giro3D correctly deallocates memory.

Interactive vector layer
Display interactive vector data on a Map.

LAS/LAZ files.
Display a LAS/LAZ file.

Blending modes
Assign various blending modes to a color layer.
Sample layer color
Retrieve the pixel value of a layer at given coordinates.

Change layer order
Move layers up and down in the map.

Layer reprojection
Reproject layers with heterogenous coordinate systems.

Color layer stress test
Stress test a map with many color layers.

Layer texture filtering.
Illustrates various texture filtering modes on layers.

Dynamic layer updates
The layer is updated when the style changes.
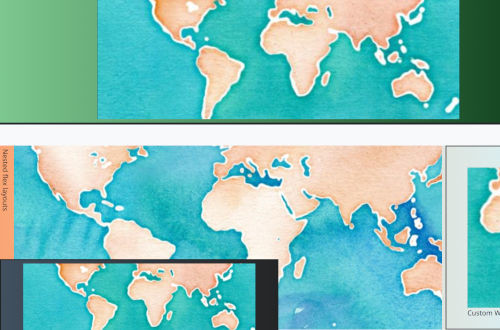
Multiple instances in different layouts
Display Giro3D scenes in with different layouts (flex, sticky, fixed, etc.).

Pointcloud from IGN Lidar HD
Display a point cloud from the Lidar HD project. Colorized with a WMS layer.

Add / Remove layers
Add and remove layers in a Map.

Arbitrary map extents
Create maps with arbitrary extents.

Contour lines
Use contour lines to display elevation levels.

Elevation profile
Create an elevation profile using a Map and a path.

Elevation ranges
Limit the display of a color layer or a map within an elevation range.

Types of opacity
Illustrates various types of opacity (map, map background, and layer)

Physical lights and shadow maps
Illustrates the use of three.js physically accurate lights and shadows on Maps.

Share layer between maps
Display multiple maps that share the same layer.

Map vertical skirts
Illustrates the optional vertical skirts on maps.

Stacking transparent maps
Illustrates how transparency in maps work.

Vertical exaggeration
Apply a vertical exaggeration on a scene.

Mapbox tilesets
Display color and elevation Mapbox tilesets.

Mask layers
Illustrates the use of mask layers.

Massive point cloud
Display a massive point cloud by aggregating dozens of datasets.
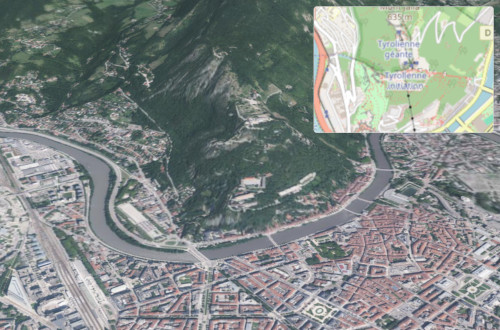
Minimap
Illustrates the use of a secondary Giro3D instance to display a minimap.

Multi-resolution elevation data
Combine multiple elevation sources into a single layer.

Stacked WMTS layers
Stack multiple WMTS layers into a single Giro3D layer.

No-data elimination
Display an elevation COG and discard no-data values.

No-data elimination after reprojection
Illustrates no-data elimination at the edges of a dataset after reprojection.

Oriented Images
Display oriented images in 3D space.

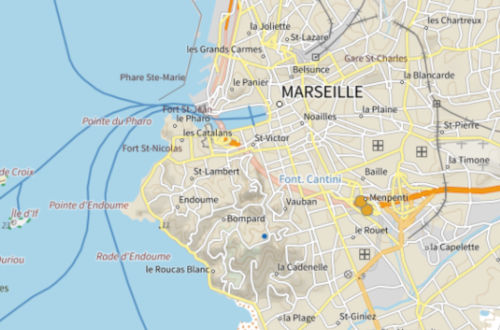
OpenStreetMap layer
Display an OpenStreetMap layer on a Map.

Partial layers
Illustrates the use of layers partially overlapping their parent Map.
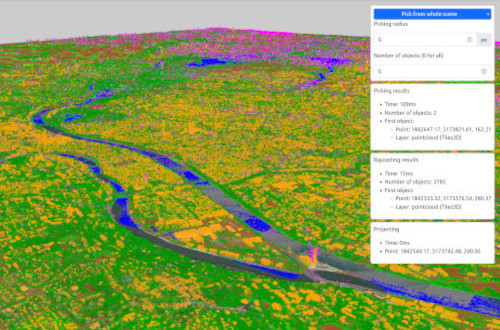
Picking
Pick objects with various methods (GPU picking, raycasting...)

Point cloud classification
Display a classified point cloud.

PointCloud Hybrid Coloring
Display a point cloud colored by a combination of several attributes

Point cloud intensity
Visualize point cloud intensity with a colormap.

Pointcloud Intersecting Volumes
Demonstrates the Intersecting Volumes feature for point clouds

Potree Point Cloud
Display a Potree point cloud.

Query map elevations
Sample elevation at various points in the map.

Simple Globe
Display a simple globe with a single color layer.

Sparse layers
Illustrates how textures are allocated when layers have a lot of empty areas.

360° panoramic image
Displays a panoramic bubble.

SRTM Tiles
Create a mosaic of SRTM tiles.

Static image
Display a single image on a Map with a StaticImageSource.

Temporal WMS layer
Load a WMS-T layer.

Three.js loaders
Load models directly from a Three.js loader (skinned mesh in this instance).

32-bit TIFF elevation tiles
Display a map with TMS TIFF tiles in Float32 format.

TopoJSON
Display a TopoJSON file on a Map.
Tracking progress
Query progress of processing tasks with the .progress and .loading APIs.

Transparent canvas background
A canvas with a transparent background.

Undraped vectors
Display GeoJSON files as meshes and symbols.

Native Vector Data
Drape vector data on a map.

Vector Tiles With OpenLayers
Display Vector Tiles on a Map using OpenLayers.

Video source
Display a video on a Map with a VideoSource.

WFS as 3D meshes
Display features from a WFS source as 3D meshes
Draped WFS
Display a WFS layer on a Map.
WMTS layer
Display a WMTS layer on a Map.